I was fooling around recently with some NHL stats visuals, and decided to update them tonight while watching the Caps-Bruins game (wouldn’t it be great if both teams lost?). Connor McDavid and Auston Matthews have had amazing seasons, and I was interested in putting their career success to date in the context of some of their peers. This was pretty easy, thanks to the folks at Quant Hockey.
The peerset for all of these visuals is Top 10 Active Goal scorers, plus McDavid and Matthews. To start, let’s take a look at cumulative career goals progressing along the x axis from the first season played to the most recent one (players with longer careers will have longer trend lines):
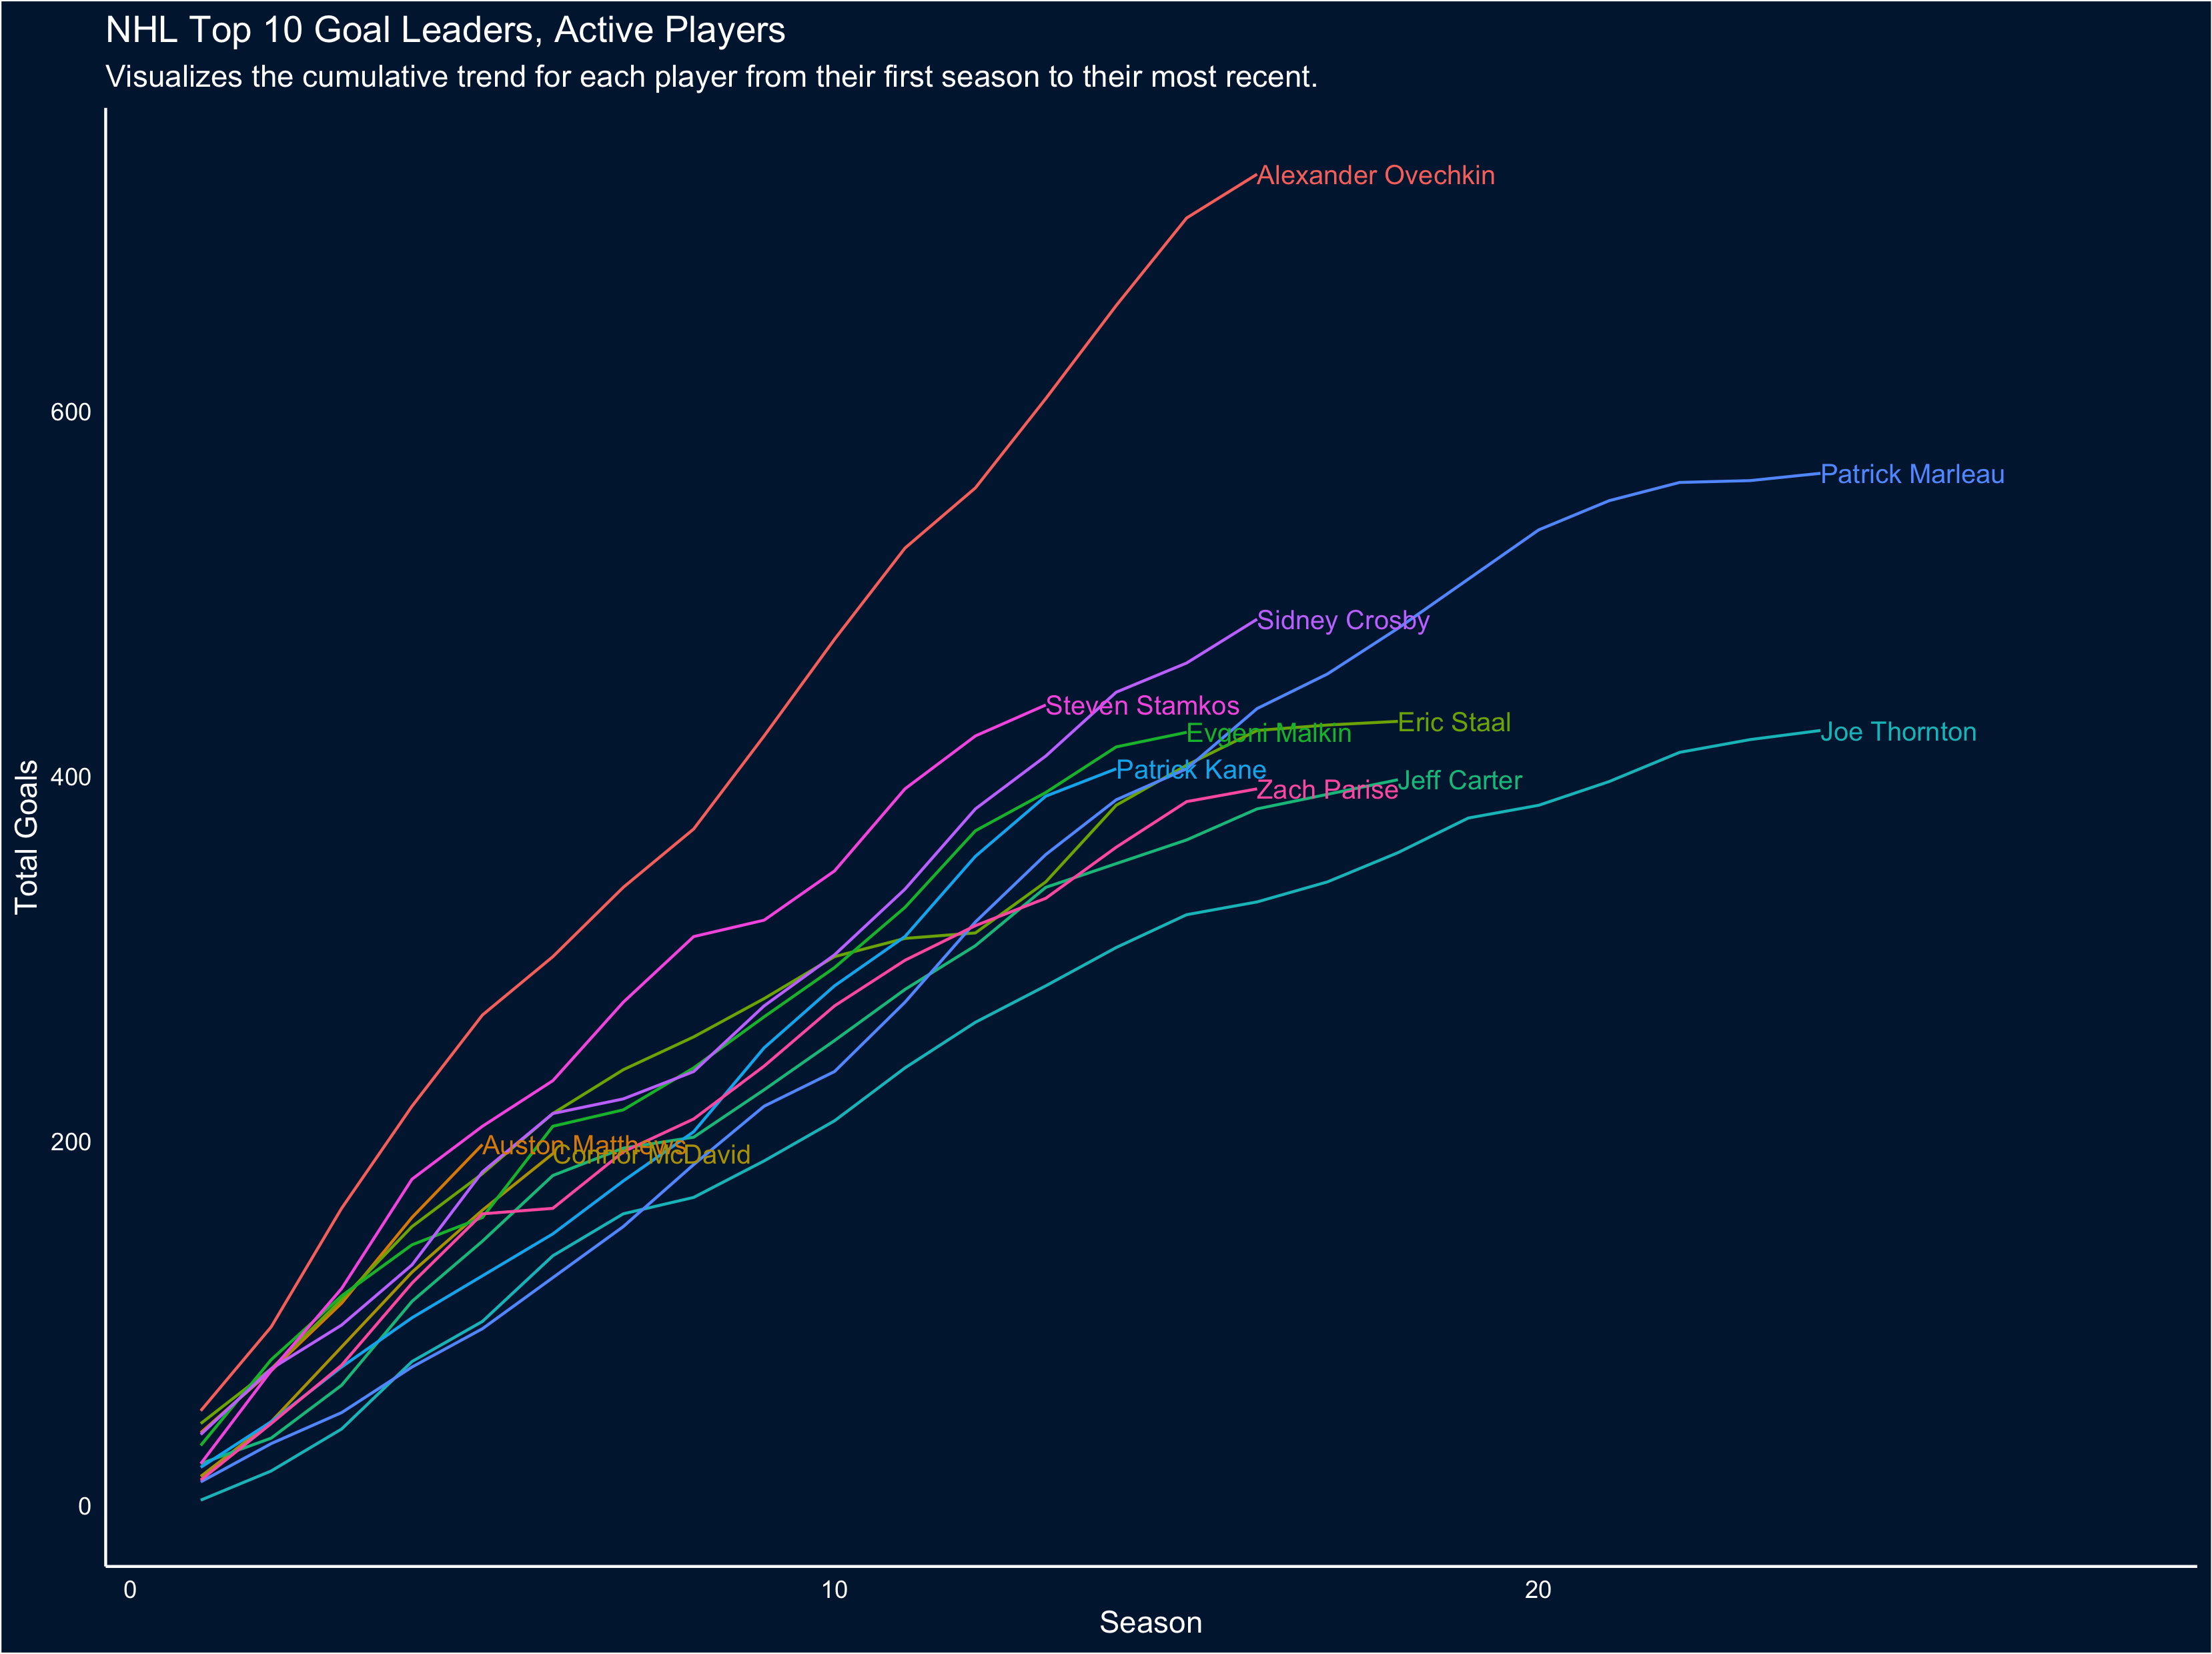
The first obvious takeaway from this chart is just how much of a goal-scoring beast Ovechkin is; also interesting to note the exceptional careers of Marleau and Thornton. But because of the number of trend lines it’s a little hard to pull out how McDavid and Matthews' careers-to-date scoring compares, so let’s restrict the visual to the first 6 seasons for each player (to match McDavid’s career so far):
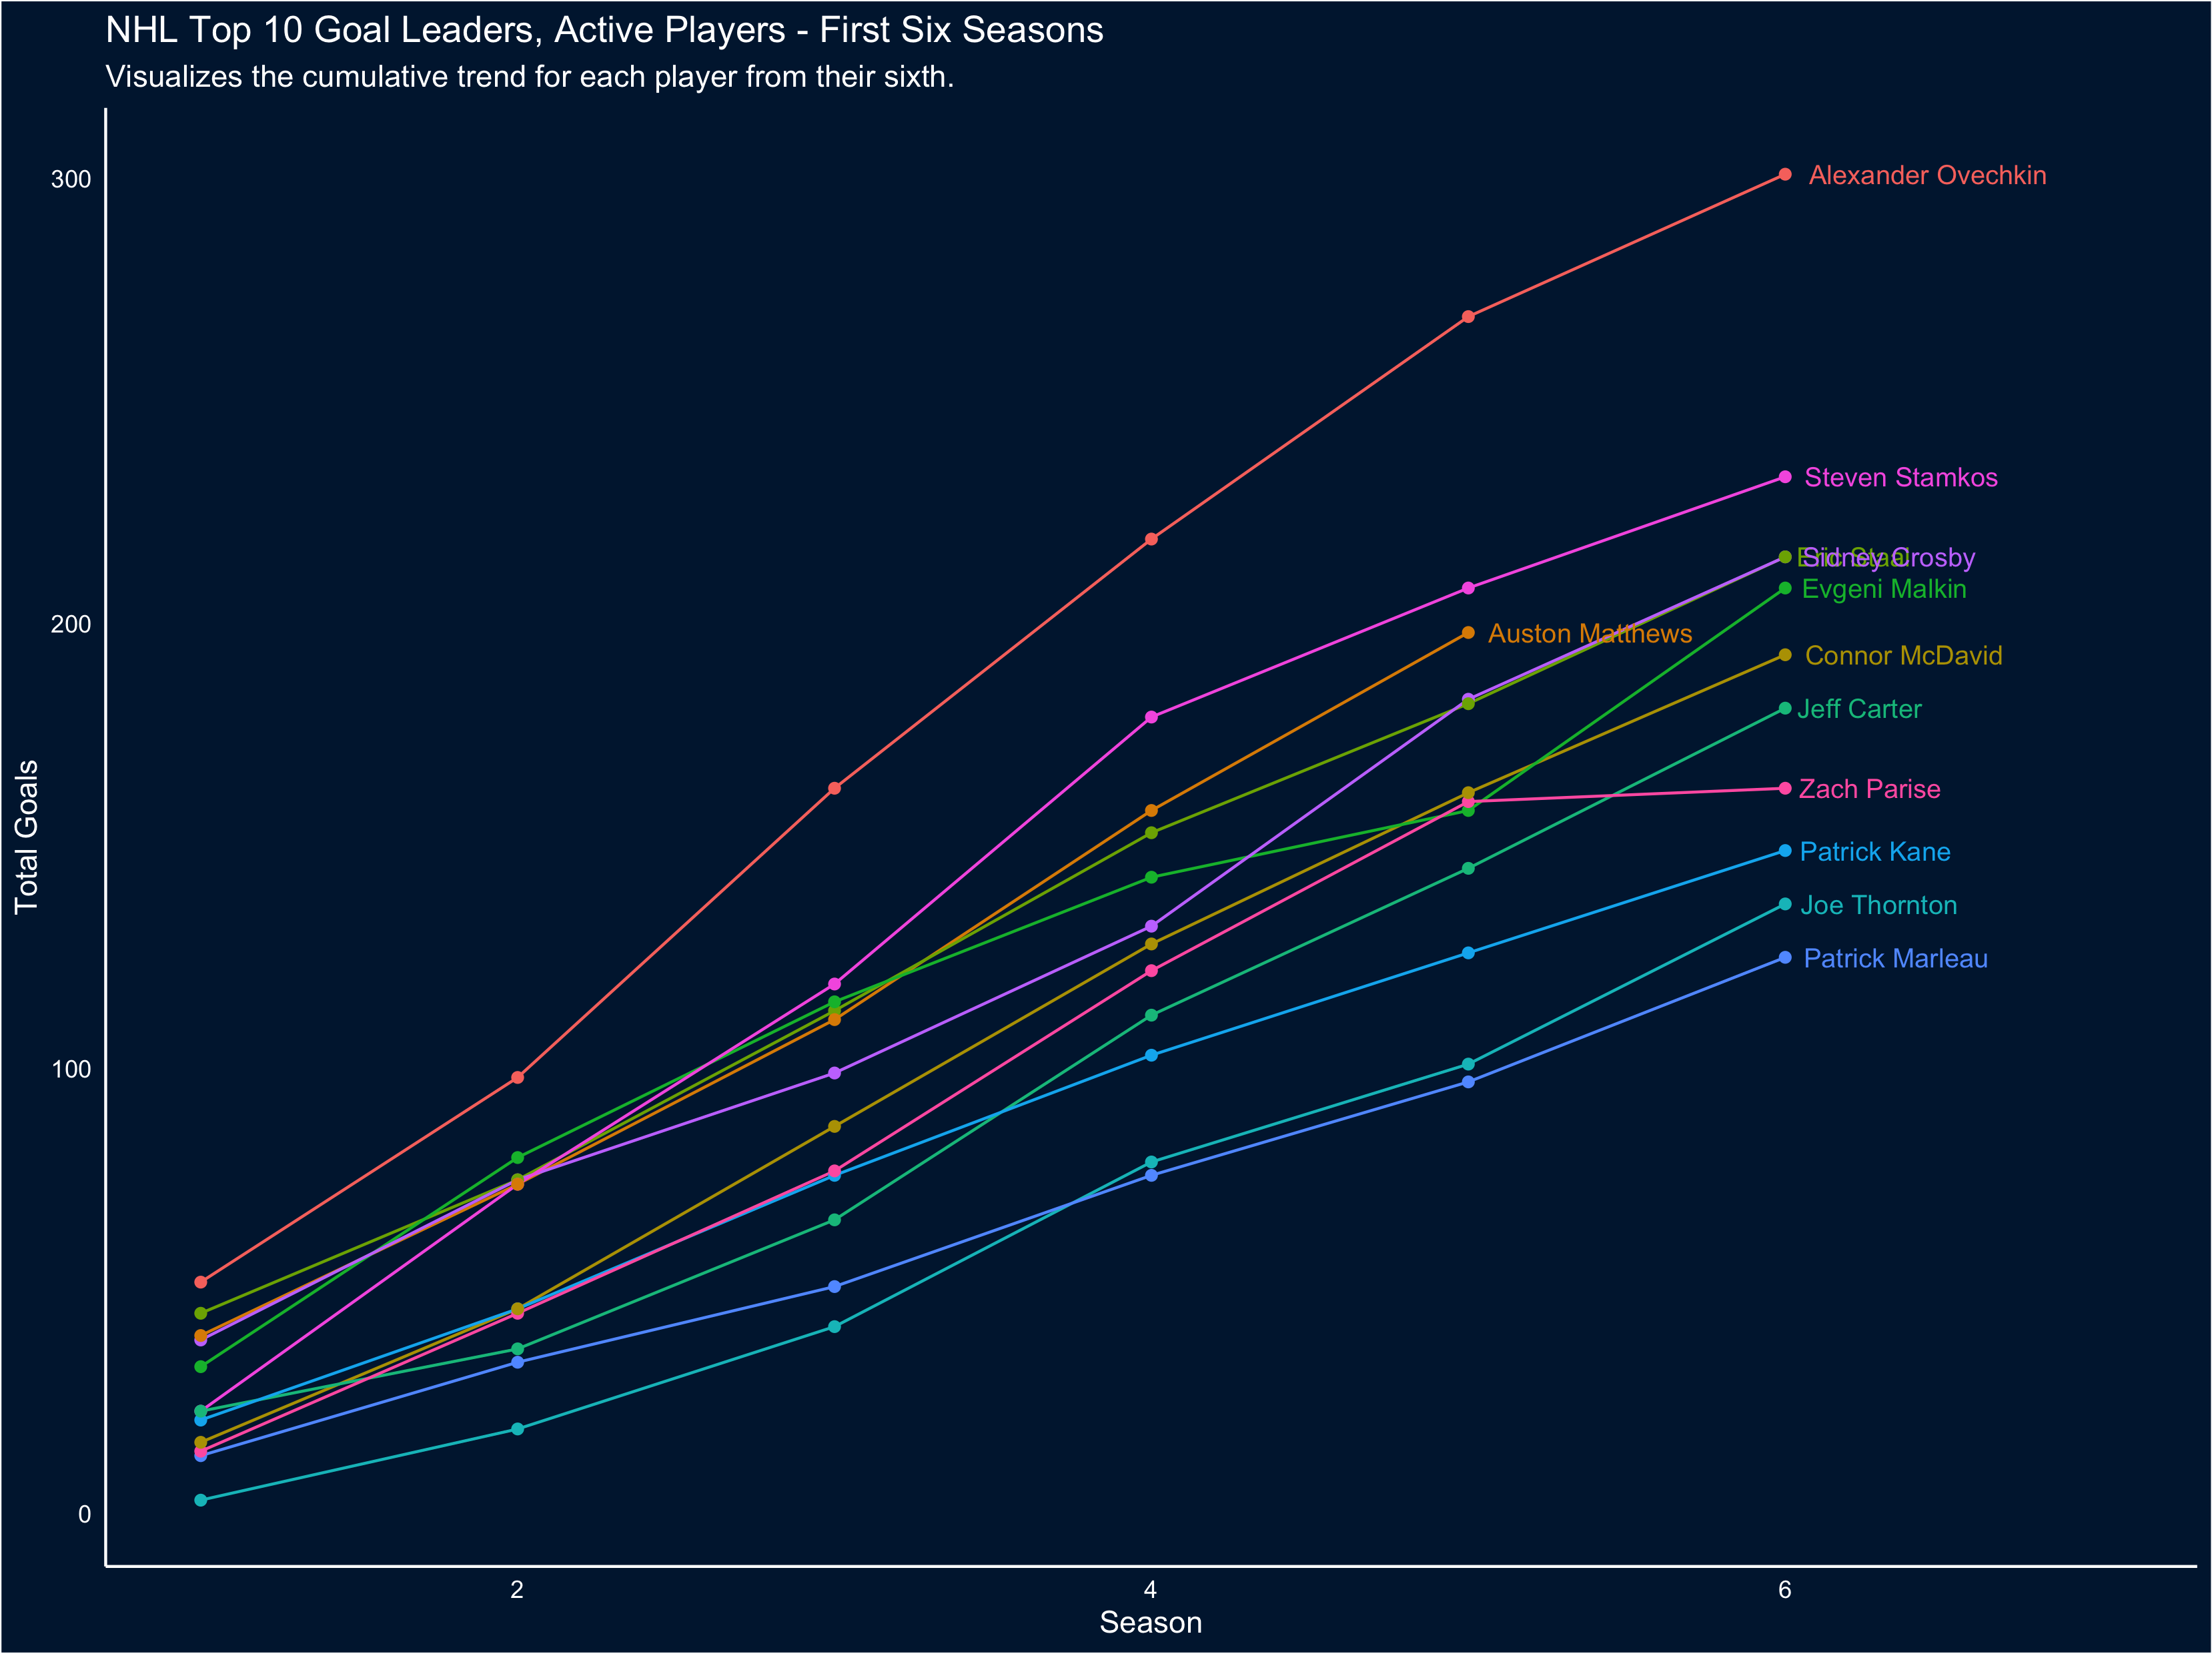
It’s easier to tell, here, exactly how special Matthews' goal scoring is: he’s outpacing everyone other than Stamkos and Ove (Incidentally, this also clearly demonstrates what a phenom Stamkos was and is).
Goal scoring is only part of the story - we can also look at total points. So let’s reproduce the first two visuals, but looking at cumulative points instead:
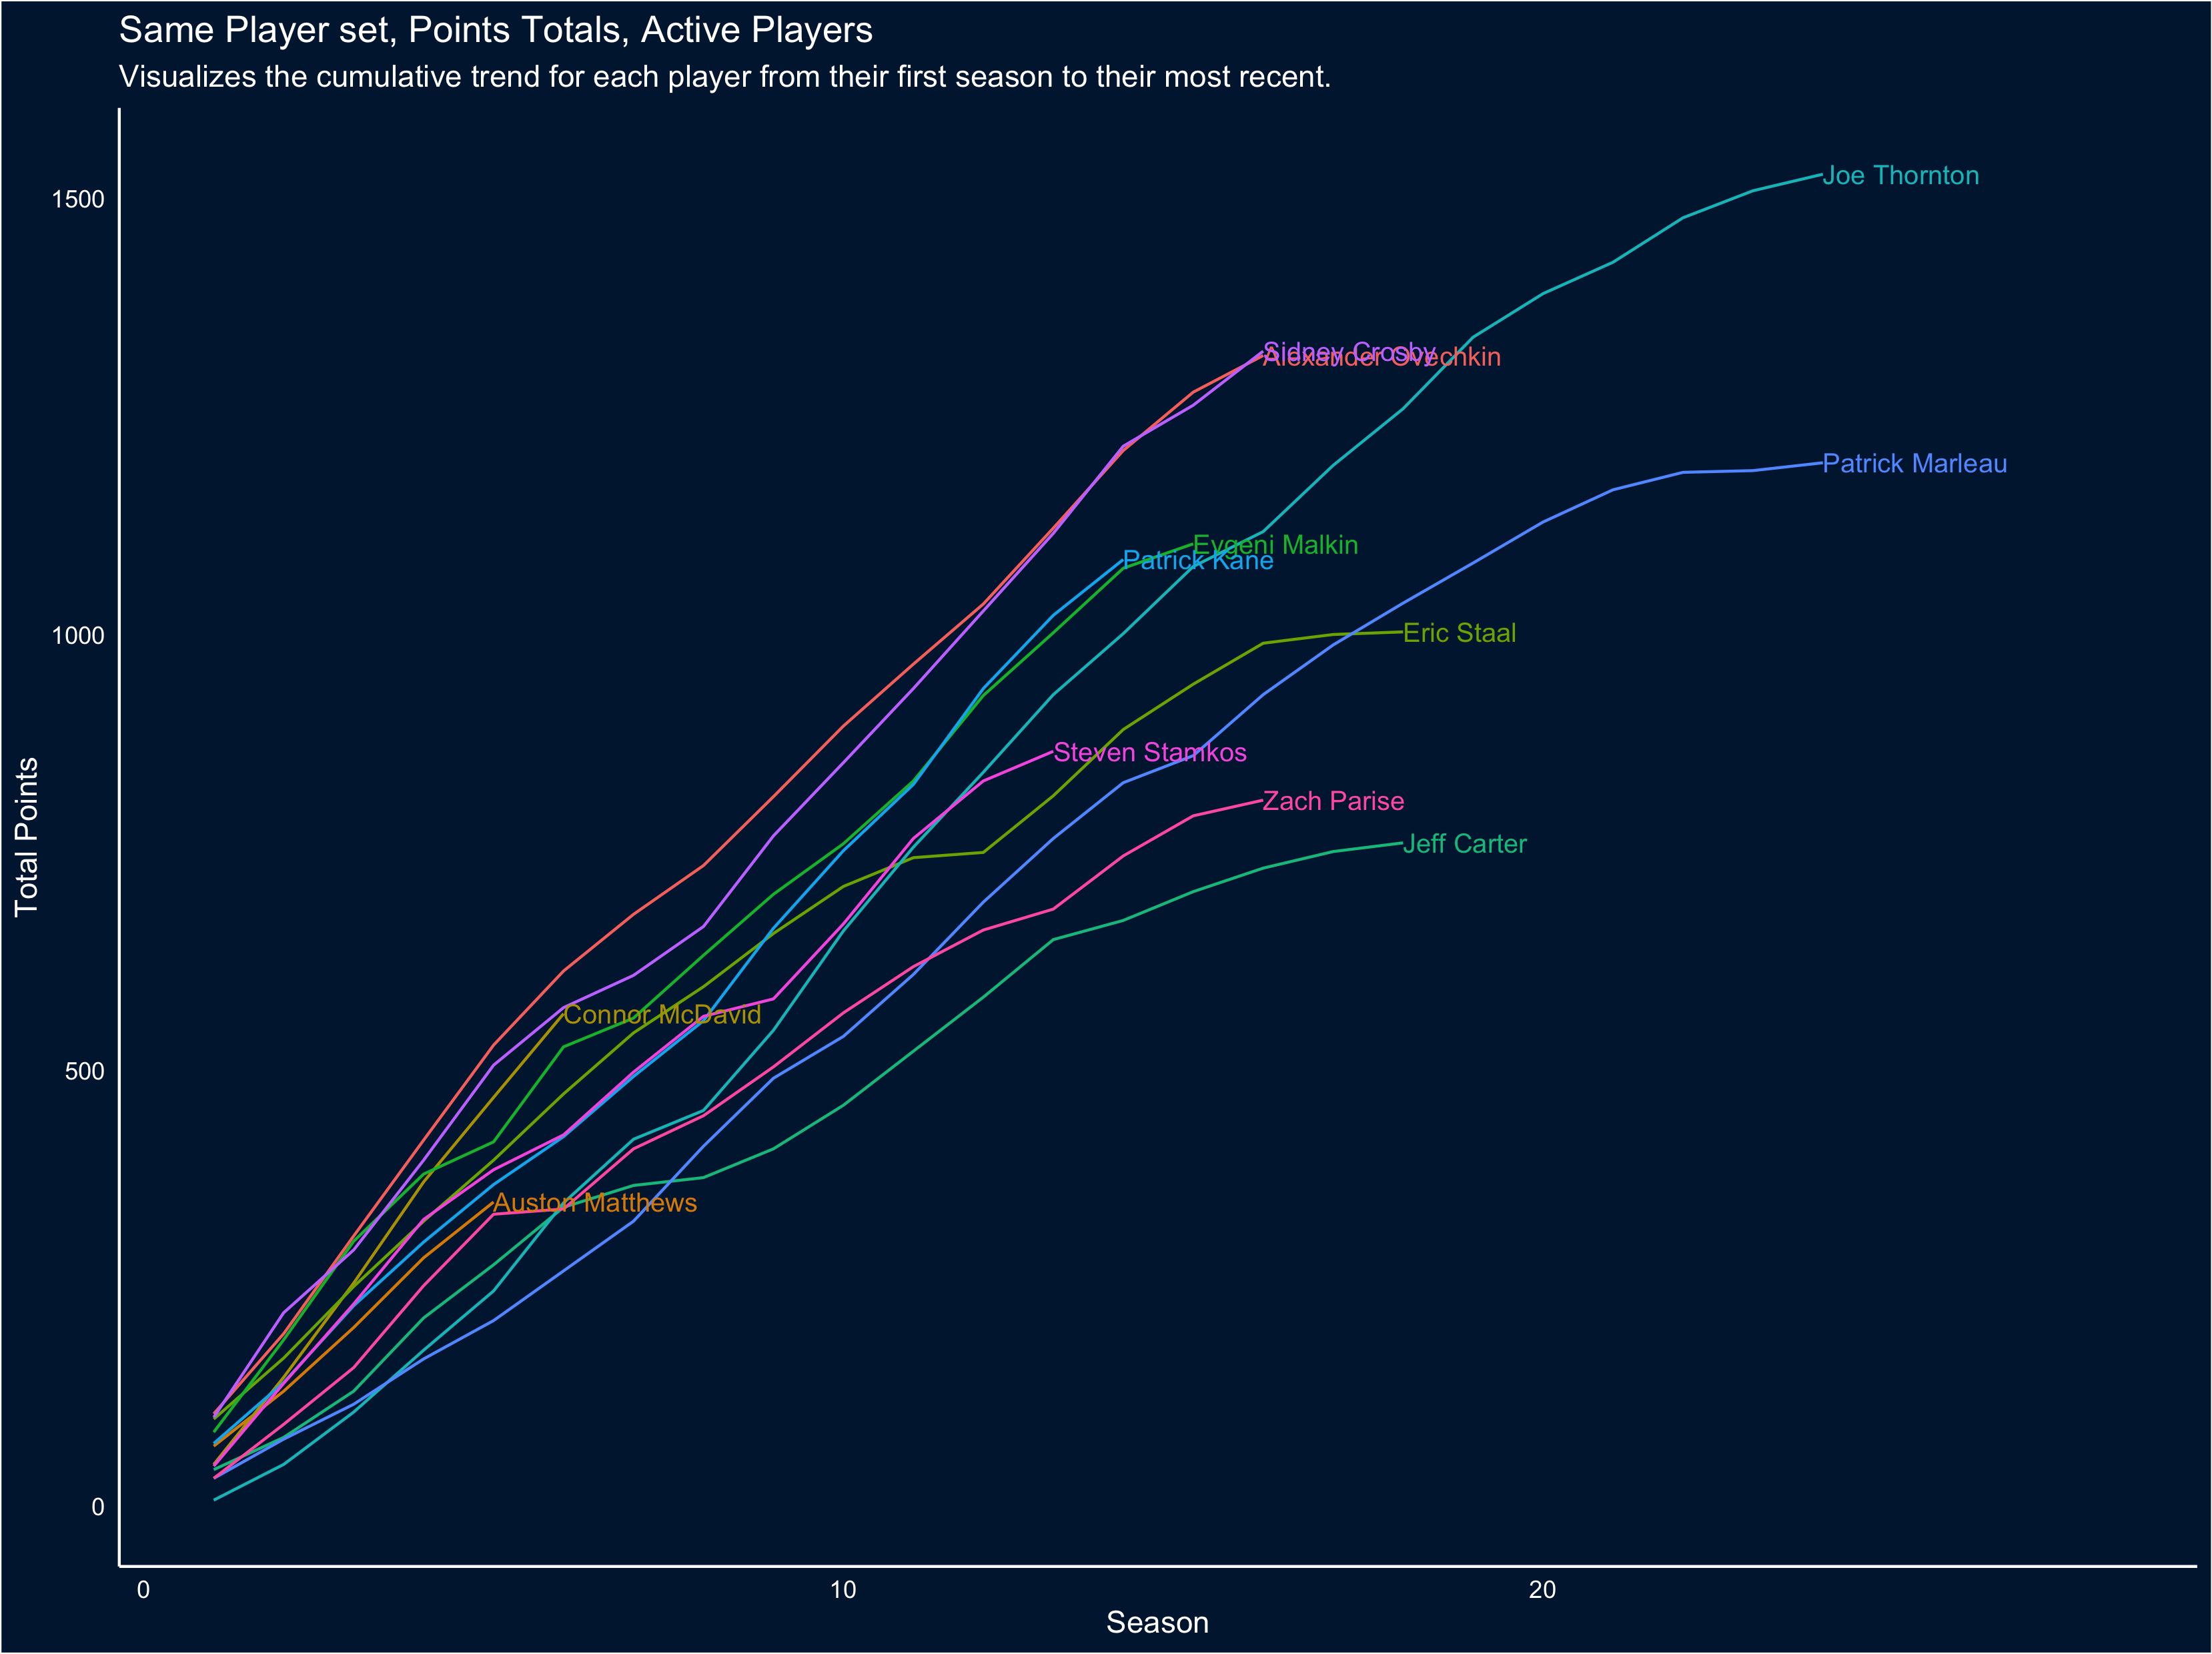
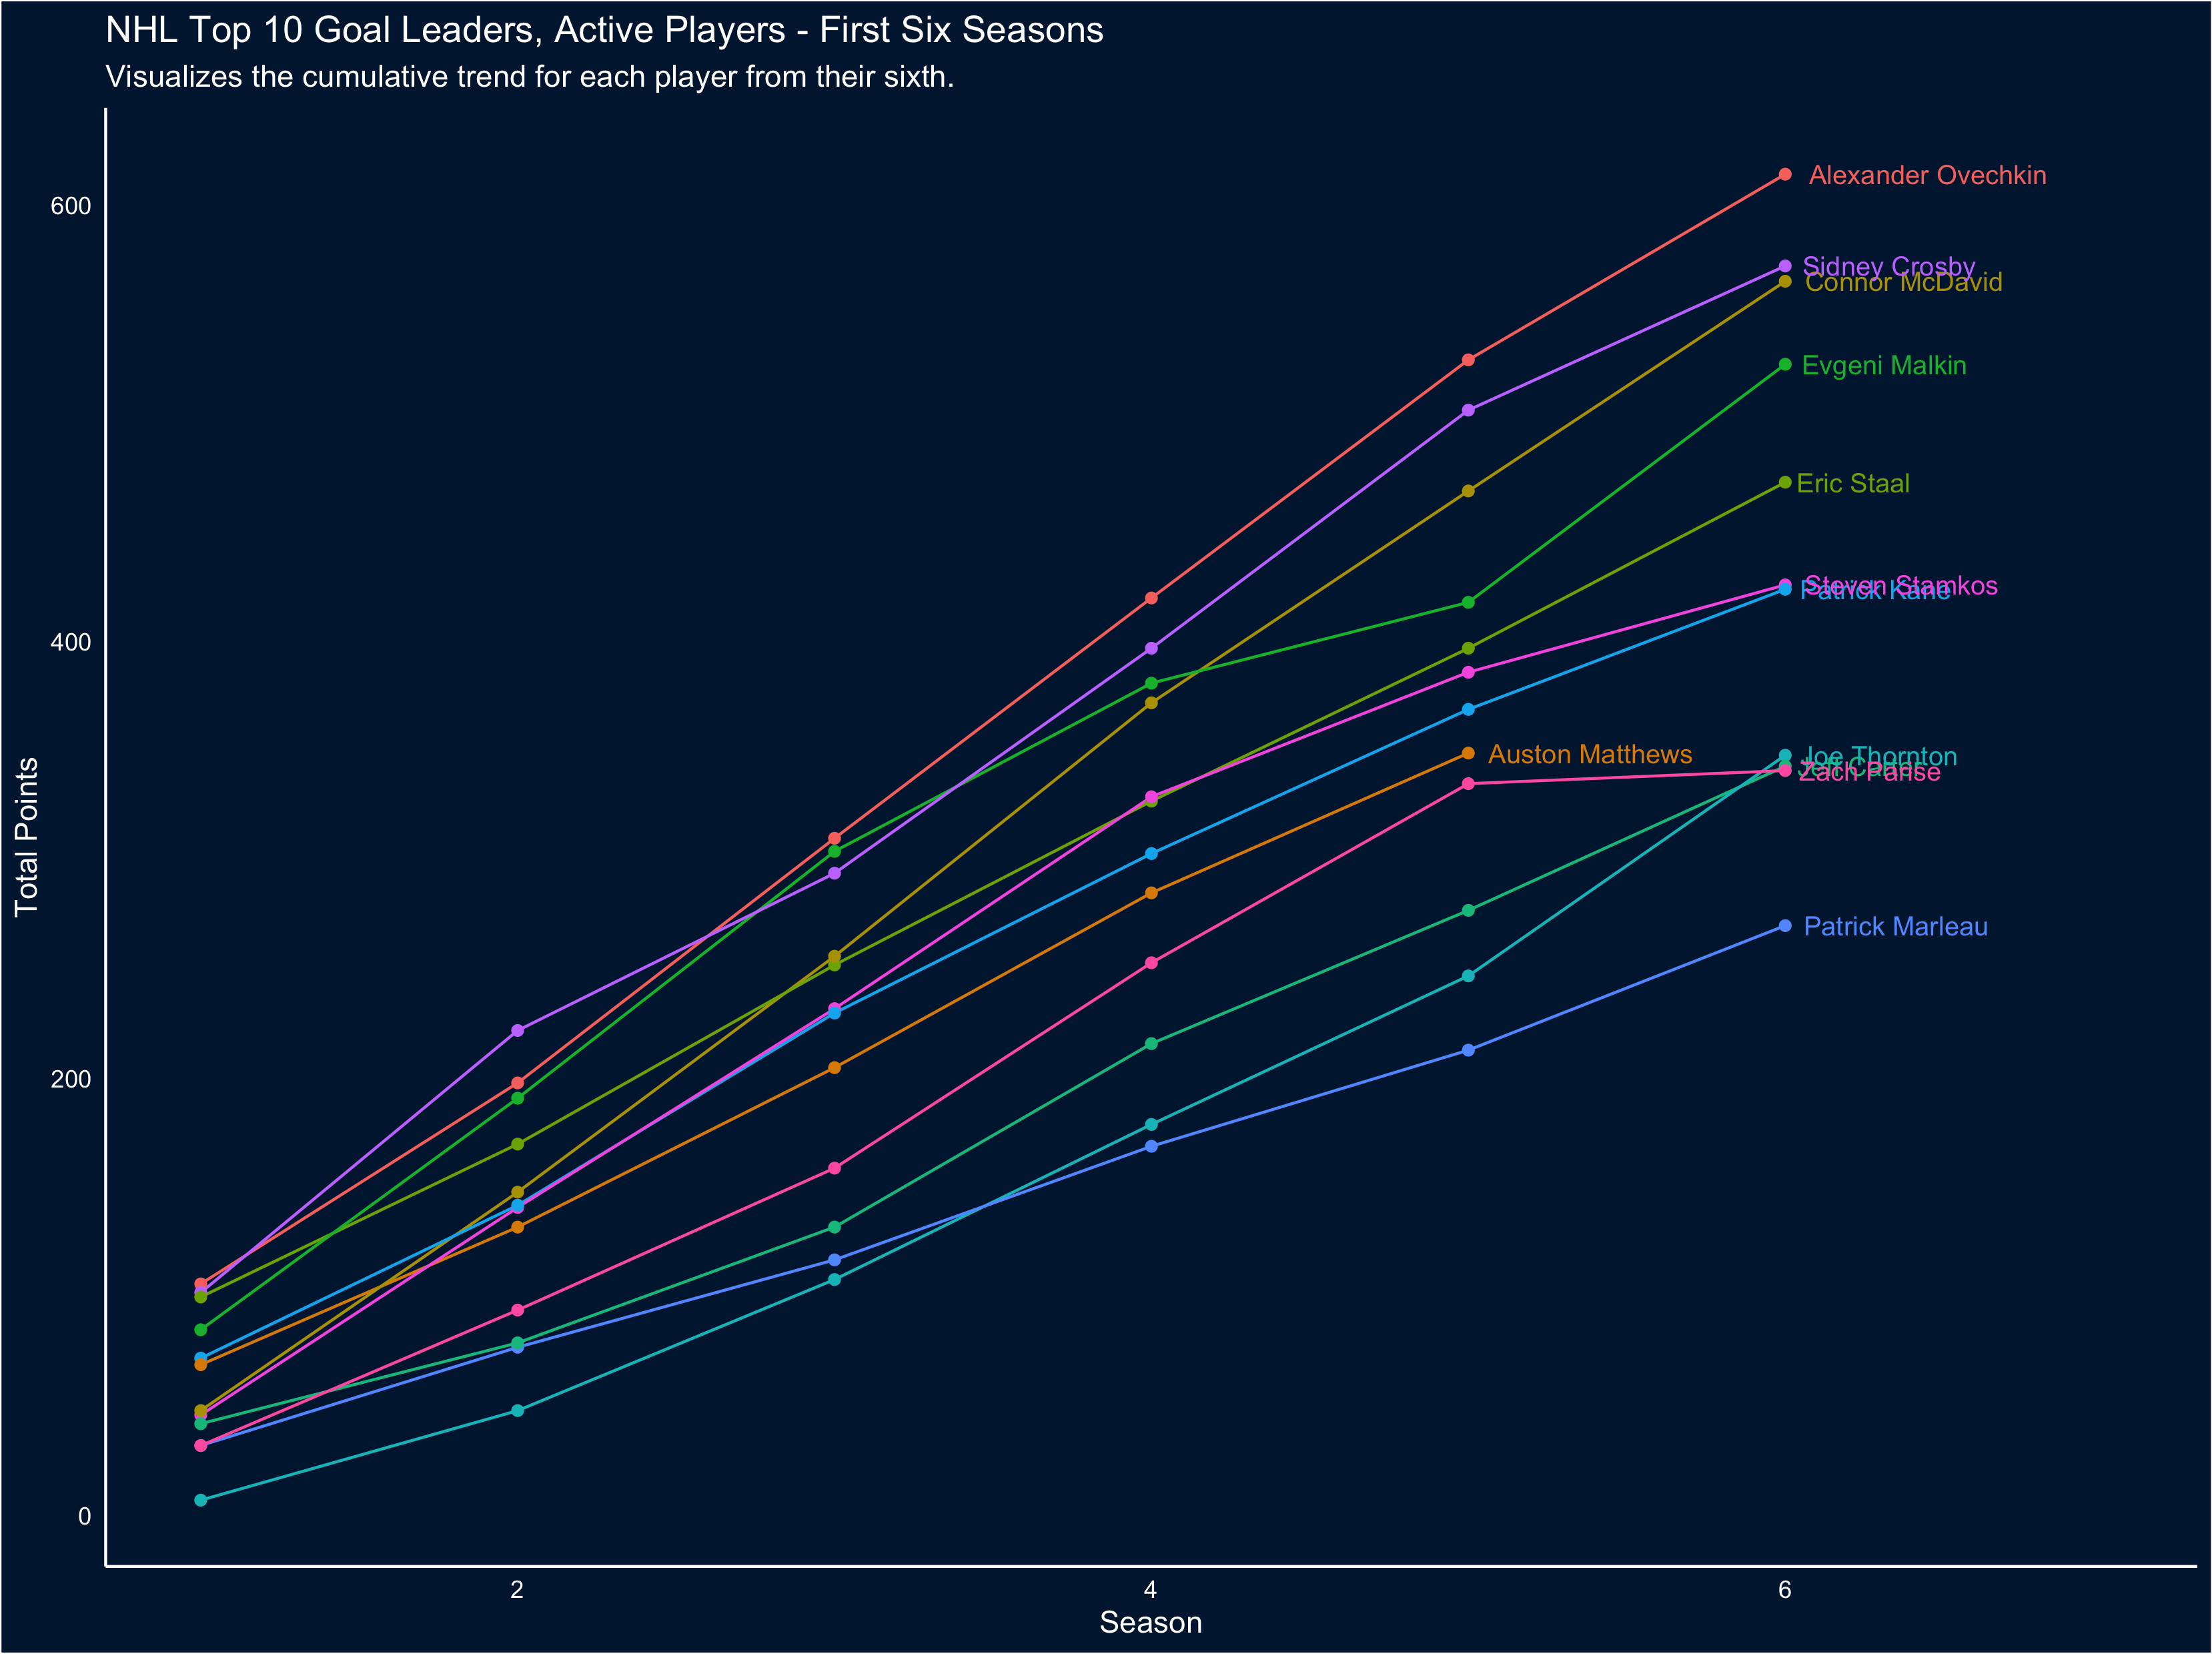
To me the amazing thing this visual captures is now neck-in-neck the careers of Crosby and Ovechkin have been… and also how much of an offensive powerhouse McDavid is, when assists are factored in. That only gets clearer when we focus on the first 6 seasons of each career:
If you’re interested, you can find the code for these visuals at this link: rentry.co/scoring